We have stripped the WWW from WWW.ROBOTFX.ORG

Important Update for RobotFX Visitors

We want to sincerely apologize for any confusion or inconvenience caused by our recent website restructuring.

The main RobotFX hub has officially moved to our new, streamlined address at robotfx.org (without the "www" prefix). While our main operations have shifted, we want to reassure you that this archives site, old.robotfx.org, will remain fully active. You can still access our complete library of past posts, historical trading analysis, and legacy articles right here.

However, for the latest updates, newer content, and a significantly faster, more optimized browsing experience, we highly recommend heading over to our primary home at https://robotfx.org.

Thank you so much for your continued support and patience as we improve our digital services.

🎉 Weekly Special! 🎉

Use Coupon at Checkout:

LOADING...

Gold: new triangle pattern

analytics62b49cdd32d1a.jpg

XAU/USD Sideways Movement!

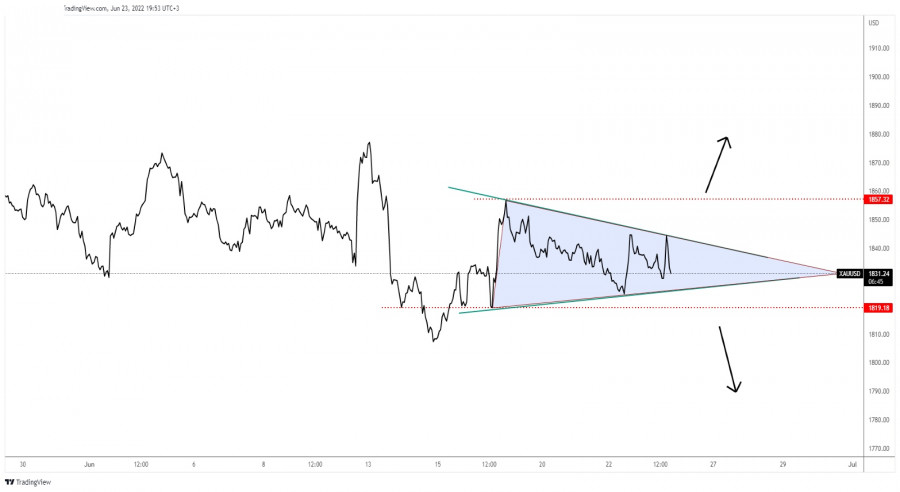
The price of gold continues to move sideways in the short term. The price action developed a triangle pattern. So, personally, I'll wait for the rate to escape from this formation before buying or selling.

The triangle's upside line and the former high of 1,857 are seen as upside obstacles, while the triangle's downside line and the 1,819 former low represent downside obstacles.

Gold Trading Conclusion!

In the short term, XAU/USD could continue to move sideways. Dropping and stabilizing below 1,819 downside obstacle could activate a strong drop. This could help the sellers to catch a larger drop.


Trading analysis offered by RobotFX and Flex EA.
Source
What 0 traders think of Gold: new triangle pattern