We have stripped the WWW from WWW.ROBOTFX.ORG

Important Update for RobotFX Visitors

We want to sincerely apologize for any confusion or inconvenience caused by our recent website restructuring.

The main RobotFX hub has officially moved to our new, streamlined address at robotfx.org (without the "www" prefix). While our main operations have shifted, we want to reassure you that this archives site, old.robotfx.org, will remain fully active. You can still access our complete library of past posts, historical trading analysis, and legacy articles right here.

However, for the latest updates, newer content, and a significantly faster, more optimized browsing experience, we highly recommend heading over to our primary home at https://robotfx.org.

Thank you so much for your continued support and patience as we improve our digital services.

🎉 Weekly Special! 🎉

Use Coupon at Checkout:

LOADING...

AUDUSD inside wedge pattern.

analytics62cf223c1b1aa.jpg

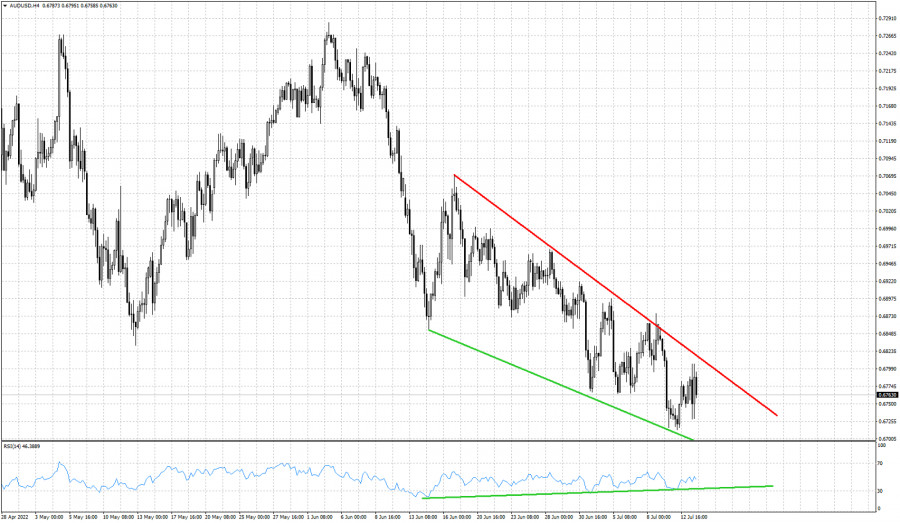
Red line- resistance

Green lines- bullish RSI divergence

AUDUSD remains in a bearish trend making lower lows and lower highs. Price has formed a downward sloping wedge pattern and the RSI is providing bullish divergence signals. The downtrend is weakening and the chances of a strong bounce higher increase. The RSI is not making new lows as price does. The red resistance trend line is found at 0.6813 and as long as price is below this level, we expect to see lower prices. However the wedge formation combined with the bullish RSI divergence are an important sign that the downtrend might soon end. Traders need to be cautious. A move higher is justified. A bullish signal will be given once price breaks above the red trend line.


Trading analysis offered by RobotFX and Flex EA.
Source
What 0 traders think of AUDUSD inside wedge pattern.