The GBP/USD has gained momentum this week from the dollar's downward correction.
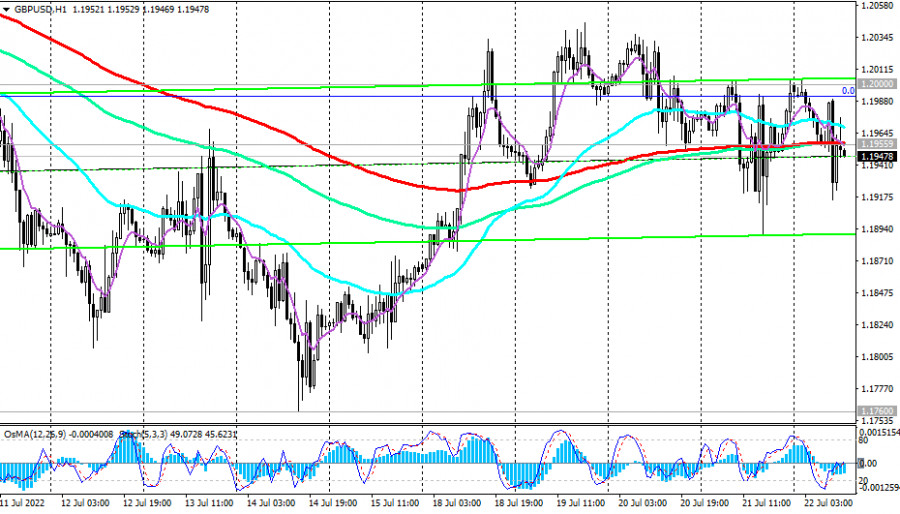
At the time of writing this article, GBP/USD is trading near the 1.1948 mark, again attempting to break through the important short-term support level of 1.1955 (200 EMA on the 1-hour chart).
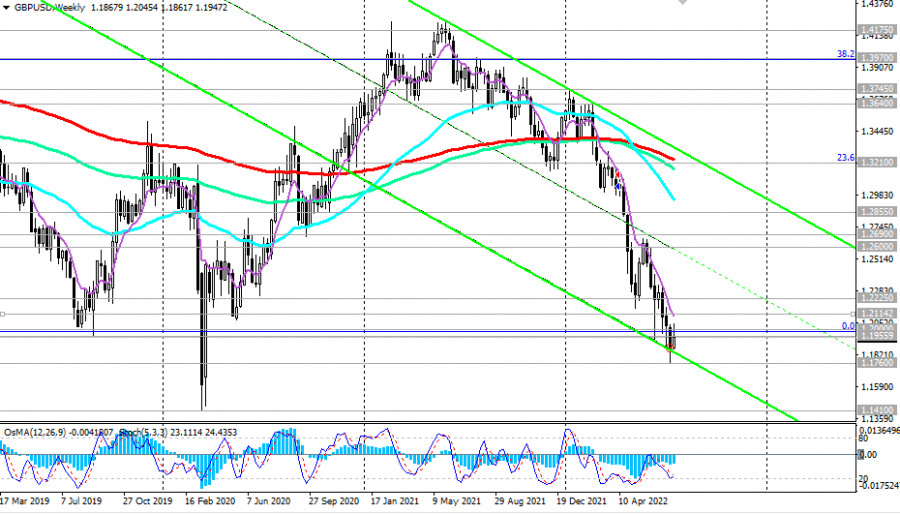
At the same time, the currency pair remains in the zone of a long-term bearish market, below the key resistance levels of 1.2855 (200 EMA on the daily chart), 1.3210 (200 EMA on the weekly chart), 1.4580 (200 EMA on the monthly chart).
Only short positions should be opened below the mentioned level of 1.1955, and the breakdown of yesterday's local low of 1.1890 may be an additional signal for building up short positions.
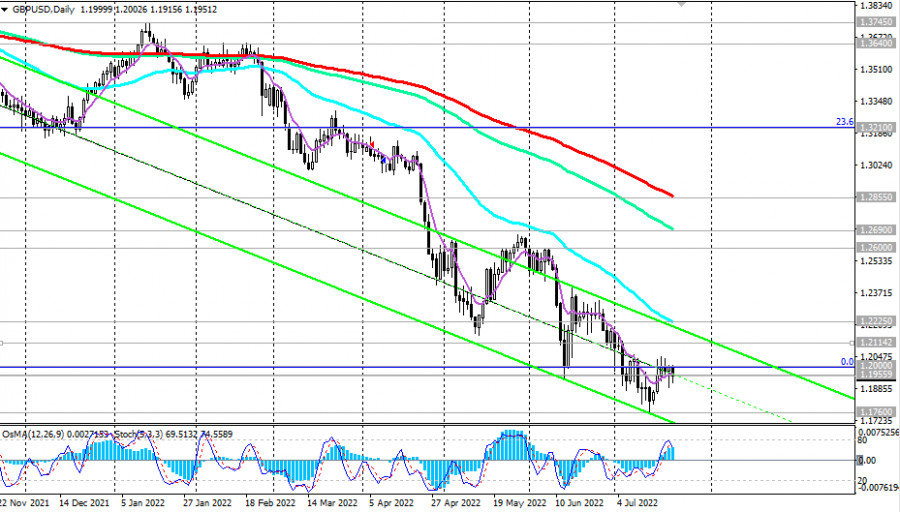
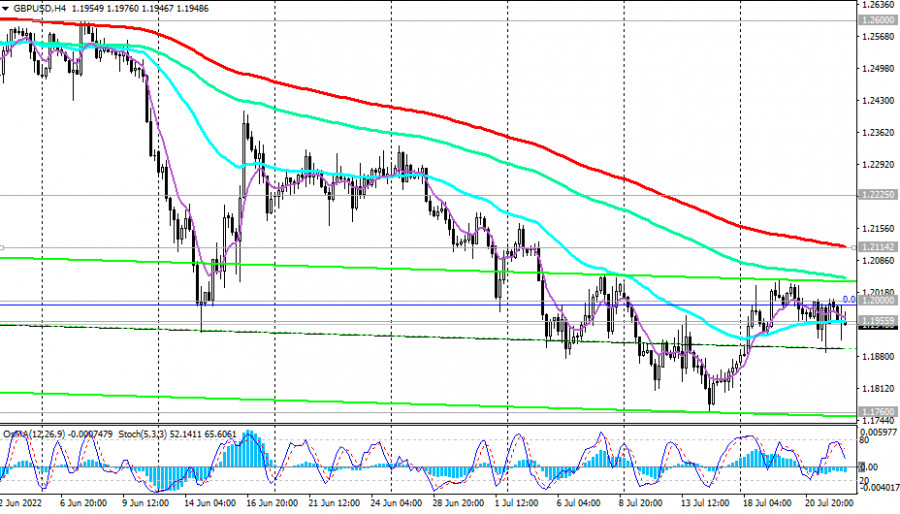
Alternatively, and after the breakdown of the resistance levels 1.1955, 1.2000, 1.2045 (this week's high), the growth of GBP/USD will continue towards the resistance level 1.2114 (200 EMA on the 4-hour chart), and in case of its breakdown—to 1.2200, the upper limit of the descending channel on the daily chart. The limit of the upward correction is at the area of the resistance level 1.2225 (50 EMA on the daily chart).
One way or another, the GBP/USD dynamics is still dominated by bearish momentum, which forced the pair to update this month its more than 2-year low (since April 2020) near 1.1760. And since the trends "do not break" so quickly, it is logical to assume the resumption of the downward dynamics of GBP/USD.
Next week, the dynamics of the GBP/USD pair will be determined mainly by the dynamics of the dollar.
The focus will be on the Fed meeting.
Support levels: 1.1900 , 1.1880 , 1.1800 , 1.1760
Resistance levels: 1.1955, 1.2000, 1.2114, 1.2200, 1.2225, 1.2400, 1.2600, 1.2690, 1.2800, 1.2855, 1.2900, 1.3000, 1.3100, 1.3210, 1.3300
Trading Tips
Sell Stop 1.1880. Stop-Loss 1.2015. Take-Profit 1.1800, 1.1760, 1.1700
Buy Stop 1.2015. Stop-Loss 1.1880. Take-Profit 1.2100, 1.2114, 1.2200, 1.2225, 1.2400, 1.2600, 1.2690, 1.2800, 1.2855, 1.2900, 1.3000, 1.3100, 1.3210, 1.3300
Trading analysis offered by RobotFX and Flex EA.
Source


Please do not spam; comments and reviews are verified prior to publishing.