We have stripped the WWW from WWW.ROBOTFX.ORG

Important Update for RobotFX Visitors

We want to sincerely apologize for any confusion or inconvenience caused by our recent website restructuring.

The main RobotFX hub has officially moved to our new, streamlined address at robotfx.org (without the "www" prefix). While our main operations have shifted, we want to reassure you that this archives site, old.robotfx.org, will remain fully active. You can still access our complete library of past posts, historical trading analysis, and legacy articles right here.

However, for the latest updates, newer content, and a significantly faster, more optimized browsing experience, we highly recommend heading over to our primary home at https://robotfx.org.

Thank you so much for your continued support and patience as we improve our digital services.

🎉 Weekly Special! 🎉

Use Coupon at Checkout:

LOADING...

Short-term technical analysis on Ethereum for July 19th, 2022.

analytics62d6e01eddad3.jpg

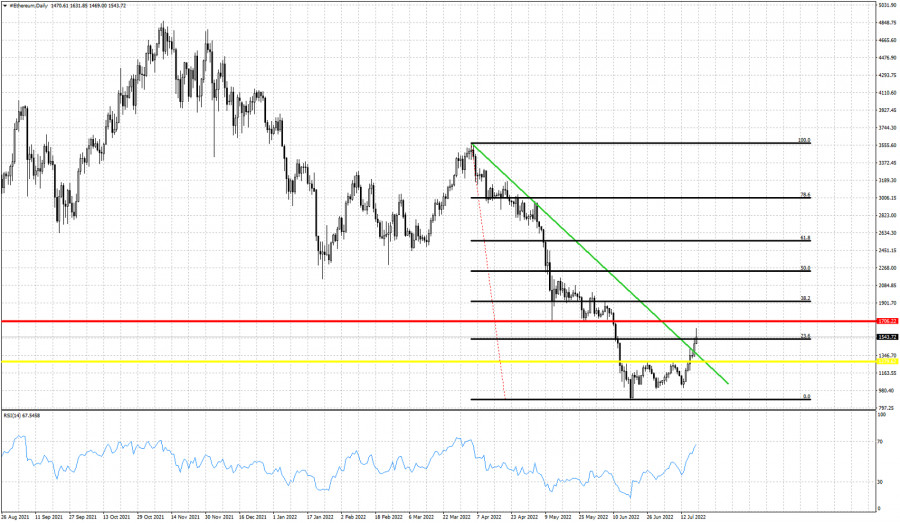
Red line -resistance

Yellow line -resistance broken

Green line- resistance broken

Black lines- Fibonacci retracement

Ethereum is showing promising signs as price has broken above short-term resistance at $1,280. We noted in our last analysis that a break above this level would bring price towards the green resistance trend line. Ethereum not only reached $1,400, it has also broken above it. Ethereum is now challenging the red horizontal resistance trend line. Next major target is the 38% Fibonacci retracement at $1,910. I believe it is possible for Ethereum to reach that levels but I would expect bears to be back and Ethereum under pressure again.


Trading analysis offered by RobotFX and Flex EA.
Source
What 0 traders think of Short-term technical analysis on Ethereum for July 19th, 2022.