We have stripped the WWW from WWW.ROBOTFX.ORG

Important Update for RobotFX Visitors

We want to sincerely apologize for any confusion or inconvenience caused by our recent website restructuring.

The main RobotFX hub has officially moved to our new, streamlined address at robotfx.org (without the "www" prefix). While our main operations have shifted, we want to reassure you that this archives site, old.robotfx.org, will remain fully active. You can still access our complete library of past posts, historical trading analysis, and legacy articles right here.

However, for the latest updates, newer content, and a significantly faster, more optimized browsing experience, we highly recommend heading over to our primary home at https://robotfx.org.

Thank you so much for your continued support and patience as we improve our digital services.

🎉 Weekly Special! 🎉

Use Coupon at Checkout:

LOADING...

BAC stock price approaching our target

analytics62f3d91c5cbb8.jpg

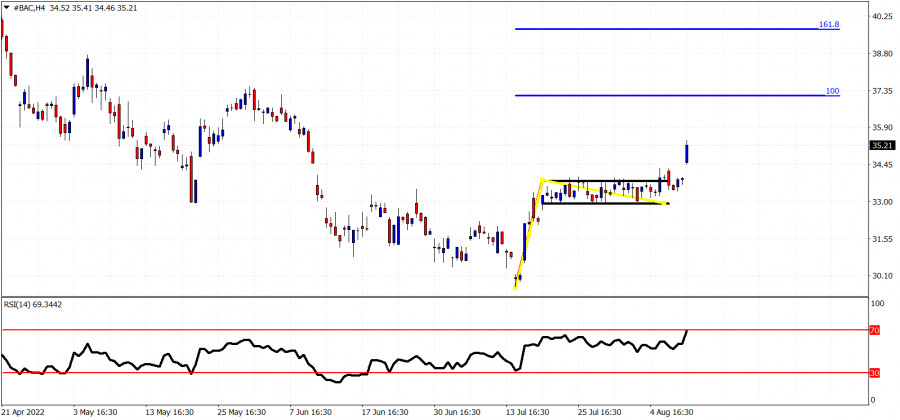
Black lines- trading range

Blue lines- Fibonacci extension targets

In the middle of July our analysis on BAC stock price noted that a break out was imminent and price would move higher towards $37. BAC stock price has broken out of the sideways trading range it was and is now trading close to $35.25. Short-term momentum is bullish and our first target of $37 seems highly likely to be reached in August. Second target is at $39.70. Support is at $33 and bulls do not want to see price break below this level as this would cancel our bullish view and targets.


Trading analysis offered by RobotFX and Flex EA.
Source
What 0 traders think of BAC stock price approaching our target