We have stripped the WWW from WWW.ROBOTFX.ORG

Important Update for RobotFX Visitors

We want to sincerely apologize for any confusion or inconvenience caused by our recent website restructuring.

The main RobotFX hub has officially moved to our new, streamlined address at robotfx.org (without the "www" prefix). While our main operations have shifted, we want to reassure you that this archives site, old.robotfx.org, will remain fully active. You can still access our complete library of past posts, historical trading analysis, and legacy articles right here.

However, for the latest updates, newer content, and a significantly faster, more optimized browsing experience, we highly recommend heading over to our primary home at https://robotfx.org.

Thank you so much for your continued support and patience as we improve our digital services.

🎉 Weekly Special! 🎉

Use Coupon at Checkout:

LOADING...

Bitcoin analysis for August 22nd, 2022.

analytics6303a47af191b.jpg

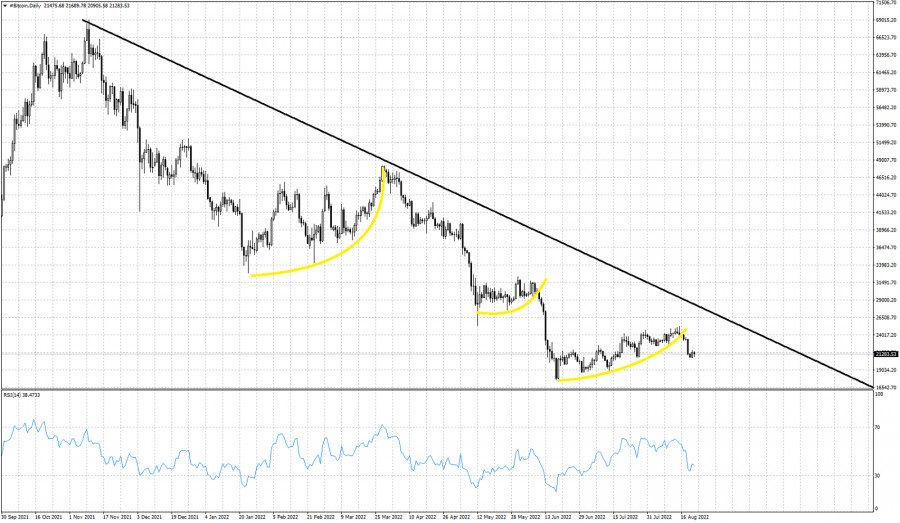
Black line- resistance trend line

Bitcoin is trading around $21,000. After a sharp decline from $24,000 to $20,800, price has paused the last two sessions and is stabilizing around $21,000. As we mentioned in previous posts, the entire upward movement in Bitcoin from $17,600 seems more likely to be a counter trend bounce rather than the start of a new up trend. Bitcoin remains below the key resistance trend line. Price is showing break down signs and similar behaviour to previous sell offs. A new lower low below $17,600 is very likely over the coming weeks. Bulls need to show more signs of strength in order to hope for a new up trend. So far price action is very similar to previous corrective bounces that ended with new lower lows.


Trading analysis offered by Flex EA.
Source
What 0 traders think of Bitcoin analysis for August 22nd, 2022.