We have stripped the WWW from WWW.ROBOTFX.ORG

Important Update for RobotFX Visitors

We want to sincerely apologize for any confusion or inconvenience caused by our recent website restructuring.

The main RobotFX hub has officially moved to our new, streamlined address at robotfx.org (without the "www" prefix). While our main operations have shifted, we want to reassure you that this archives site, old.robotfx.org, will remain fully active. You can still access our complete library of past posts, historical trading analysis, and legacy articles right here.

However, for the latest updates, newer content, and a significantly faster, more optimized browsing experience, we highly recommend heading over to our primary home at https://robotfx.org.

Thank you so much for your continued support and patience as we improve our digital services.

🎉 Weekly Special! 🎉

Use Coupon at Checkout:

LOADING...

Bitcoin analysis of the last two months.

analytics62f66bccb7bc4.jpg

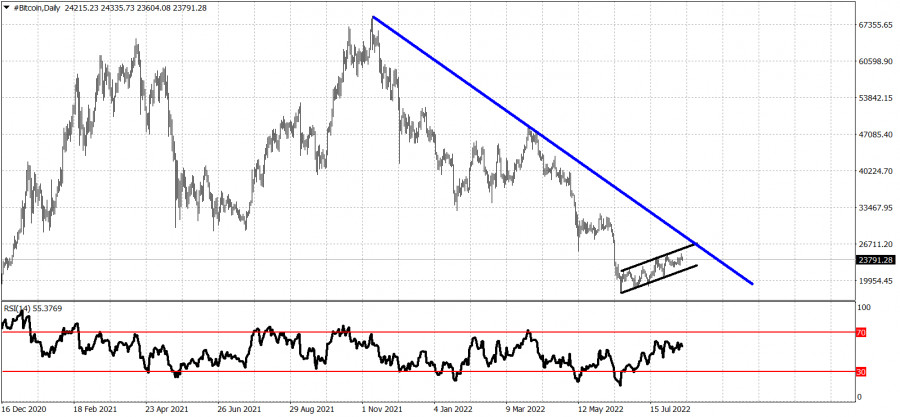
Blue line- major resistance trend line

Black lines- short-term bullish channel

After the major low in June around $17,600, Bitcoin is slowly but steadily rising, making higher highs and higher lows. Bitcoin has retraced only 23.6% of the decline from $48,000 area. Bitcoin technically remains in a short-term bullish trend as price has created a clear upward sloping channel. However looking at the bigger picture, this upward movement looks more probably as a counter trend bounce and a pause to the bigger down trend. The major and most important resistance is at the blue downward sloping trend line at $27,000-$28,000. As long as price is below this trend line we believe that this is only a counter trend bounce.


Trading analysis offered by RobotFX and Flex EA.
Source
What 0 traders think of Bitcoin analysis of the last two months.