We have stripped the WWW from WWW.ROBOTFX.ORG

Important Update for RobotFX Visitors

We want to sincerely apologize for any confusion or inconvenience caused by our recent website restructuring.

The main RobotFX hub has officially moved to our new, streamlined address at robotfx.org (without the "www" prefix). While our main operations have shifted, we want to reassure you that this archives site, old.robotfx.org, will remain fully active. You can still access our complete library of past posts, historical trading analysis, and legacy articles right here.

However, for the latest updates, newer content, and a significantly faster, more optimized browsing experience, we highly recommend heading over to our primary home at https://robotfx.org.

Thank you so much for your continued support and patience as we improve our digital services.

🎉 Weekly Special! 🎉

Use Coupon at Checkout:

LOADING...

Ethereum continues moving sideways

analytics63063e6c3cecc.jpg

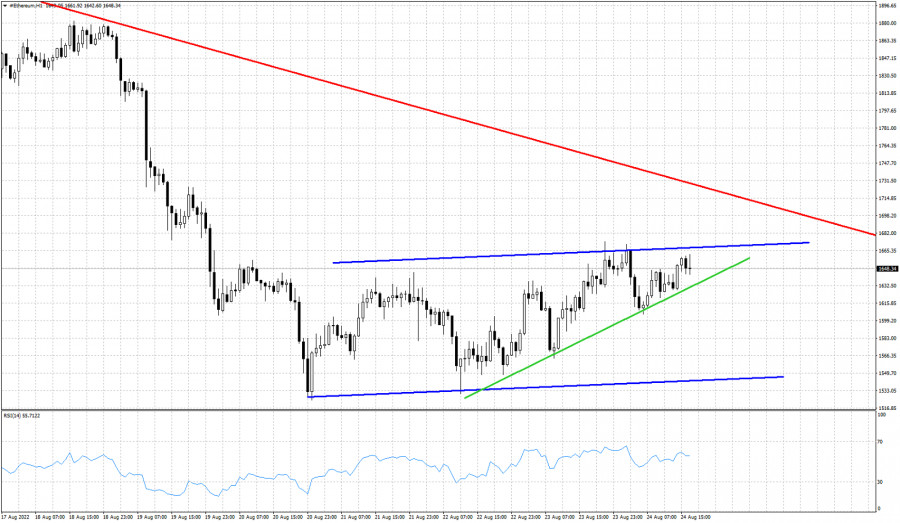
Red line- resistance trend line

Blue lines- trading range

Green line- short-term support trend line

Since the recent low on August 21st around $1,524, Ethereum bounced towards $1,665 but remains trapped inside a trading range with no real progress. The sharp decline from $2,030 ended at $1,524 but price shows no sign of strength for a big bounce higher. Short-term support is found at $1,630, by the green upward sloping trend line. Resistance is at $1,665 by the upper boundary of the trading range. Ethereum is expected to make another move lower at least towards $1,550.I do not expect Ethereum to move higher than $1,750 at this point in time.


Trading analysis offered by Flex EA.
Source
What 0 traders think of Ethereum continues moving sideways