We have stripped the WWW from WWW.ROBOTFX.ORG

Important Update for RobotFX Visitors

We want to sincerely apologize for any confusion or inconvenience caused by our recent website restructuring.

The main RobotFX hub has officially moved to our new, streamlined address at robotfx.org (without the "www" prefix). While our main operations have shifted, we want to reassure you that this archives site, old.robotfx.org, will remain fully active. You can still access our complete library of past posts, historical trading analysis, and legacy articles right here.

However, for the latest updates, newer content, and a significantly faster, more optimized browsing experience, we highly recommend heading over to our primary home at https://robotfx.org.

Thank you so much for your continued support and patience as we improve our digital services.

🎉 Weekly Special! 🎉

Use Coupon at Checkout:

LOADING...

Ichimoku cloud indicator analysis on EURUSD for August 12th, 2022.

analytics62f669433cfa1.jpg

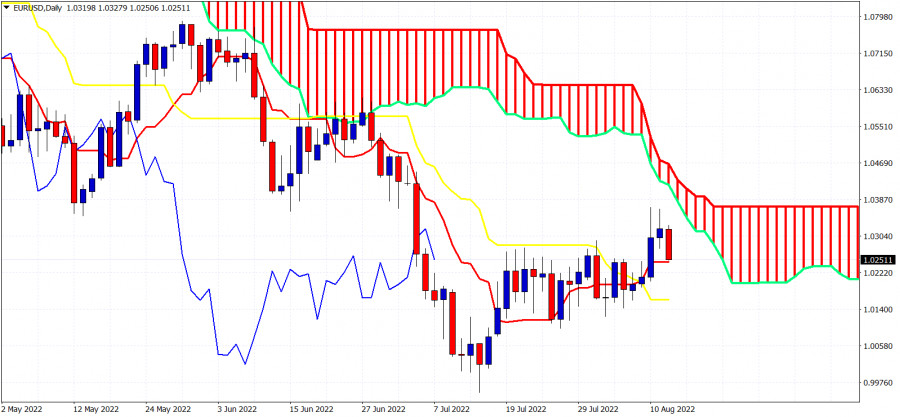
EURUSD is trading around 1.0245. The fx pair is in red territory today challenging the short-term support by the tenkan-sen (red line indicator). As we mentioned in our previous analysis on EURUSD, trend in the Daily chart remains bearish according to the Ichimoku cloud indicator because price remains below the Kumo (cloud). There are some signs of strength but no reversal confirmation. The tenkan-sen is short-term support. The kijun-sen (yellow line indicator) at 1.0160 remains the most important short-term support by the Ichimoku cloud indicator system. Our view remains the same, as long as price is below the cloud, the bounce is considered only as a counter trend move.


Trading analysis offered by RobotFX and Flex EA.
Source
What 0 traders think of Ichimoku cloud indicator analysis on EURUSD for August 12th, 2022.