We have stripped the WWW from WWW.ROBOTFX.ORG

Important Update for RobotFX Visitors

We want to sincerely apologize for any confusion or inconvenience caused by our recent website restructuring.

The main RobotFX hub has officially moved to our new, streamlined address at robotfx.org (without the "www" prefix). While our main operations have shifted, we want to reassure you that this archives site, old.robotfx.org, will remain fully active. You can still access our complete library of past posts, historical trading analysis, and legacy articles right here.

However, for the latest updates, newer content, and a significantly faster, more optimized browsing experience, we highly recommend heading over to our primary home at https://robotfx.org.

Thank you so much for your continued support and patience as we improve our digital services.

🎉 Weekly Special! 🎉

Use Coupon at Checkout:

LOADING...

Ichimoku cloud indicator analysis on EURUSD for August 26th, 2022.

analytics6308c422d8219.jpg

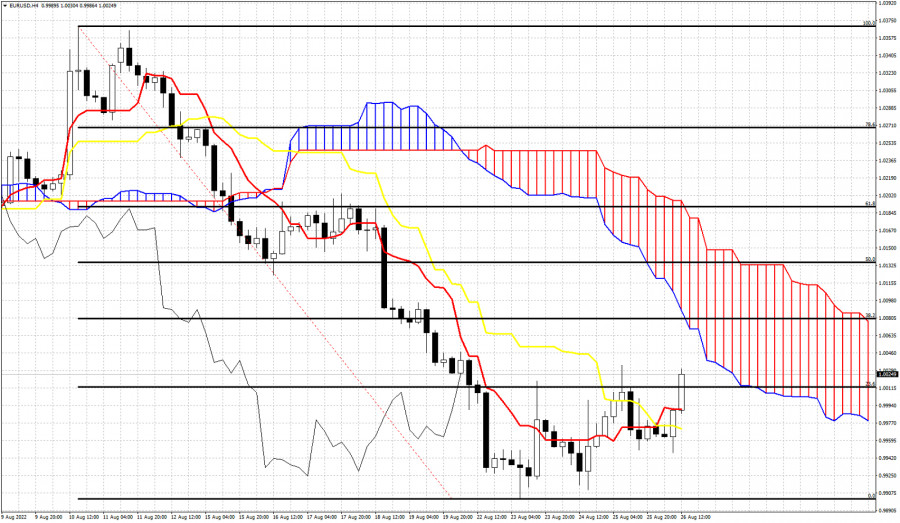
Black lines- Fibonacci retracements

EURUSD is trading above recent highs of 1.0010. Price is now at 1.0030 with a 4 hour candle close above the recent highs and above both the tenkan-sen (red line indicator) and the kijun-sen (yellow line indicator). Support by the two indicators is at 0.9992 and 0.9970. Price remains below the Kumo (cloud) which is the main bearish characteristic of the chart. The Chikou span (black line indicator) is still below the candlestick pattern trying to break above resistance at 1.0030-1.0050. As long as price is below the Kumo, trend will remain bearish according to the indicator. There are some signs that could be the start of a bounce or trend reversal, but it is too early to tell. Upside bounce target for EURUSD is the lower cloud boundary and 50% retracement at 1.0070-1.0080.


Trading analysis offered by Flex EA.
Source
What 0 traders think of Ichimoku cloud indicator analysis on EURUSD for August 26th, 2022.