We have stripped the WWW from WWW.ROBOTFX.ORG

Important Update for RobotFX Visitors

We want to sincerely apologize for any confusion or inconvenience caused by our recent website restructuring.

The main RobotFX hub has officially moved to our new, streamlined address at robotfx.org (without the "www" prefix). While our main operations have shifted, we want to reassure you that this archives site, old.robotfx.org, will remain fully active. You can still access our complete library of past posts, historical trading analysis, and legacy articles right here.

However, for the latest updates, newer content, and a significantly faster, more optimized browsing experience, we highly recommend heading over to our primary home at https://robotfx.org.

Thank you so much for your continued support and patience as we improve our digital services.

🎉 Weekly Special! 🎉

Use Coupon at Checkout:

LOADING...

Ichimoku cloud indicator analysis on Gold for August 26th, 2022.

analytics6308c5448e6c4.jpg

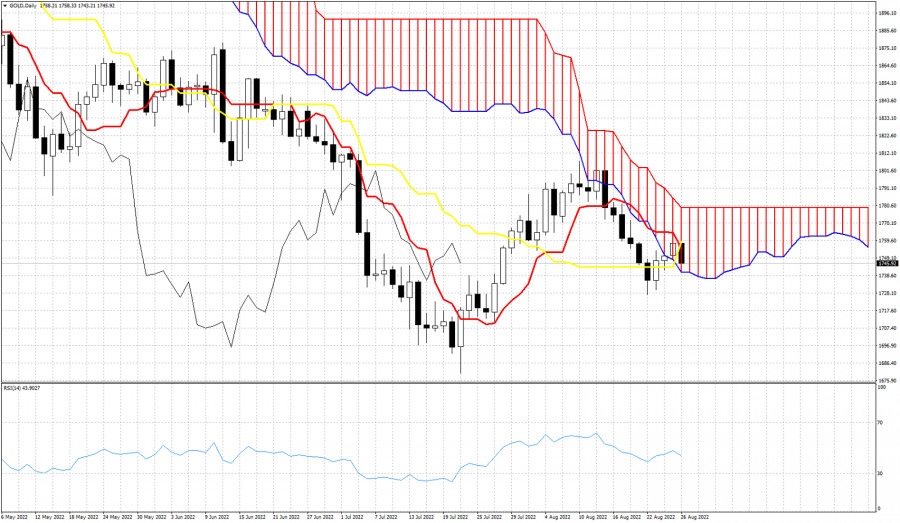
Gold price is under pressure. Price is around $1,747 but the kijun-sen (yellow line indicator) has moved higher and the tenkan-sen (red line indicator) is turning lower. A cross of the tenkan-sen below the kijun-sen would be a bearish signal. If price breaks again below and out of the cloud, we will have an even stronger bearish signal. Cloud support is at $1,740. Bears need to break below this level in order to continue their move lower towards $1,700. Bulls on the other hand need to break above $1,760 at least and then above $1,780.


Trading analysis offered by Flex EA.
Source
What 0 traders think of Ichimoku cloud indicator analysis on Gold for August 26th, 2022.