Technical market outlook of Ethereum (cryptocurrency) : Trading Ethereum (ETH/USD) :
Since three weeks ETH/USD increased within an up channel, for that Ethereum hits new highs $ 1,620 and $ 1,689. Ethereum price had a significant breakout above the price of $ 1,620 and $ 1,689.
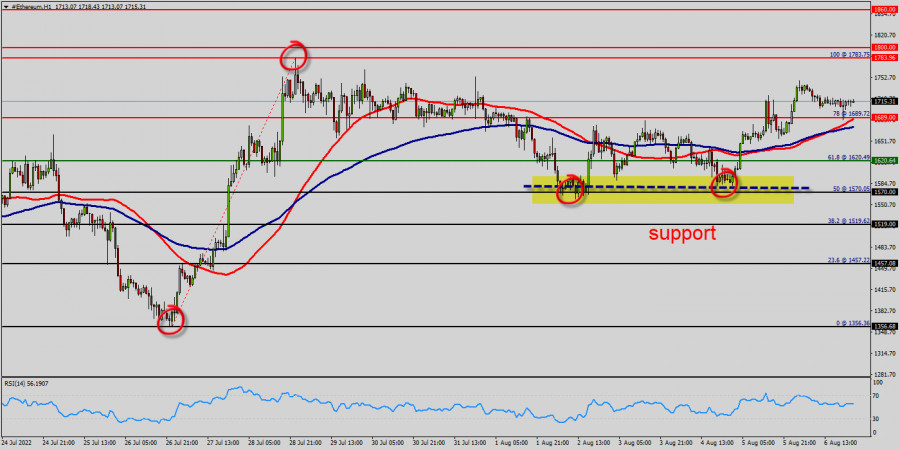
ETH/USD is part of a very strong bullish trend. Traders may consider trading only long positions as long as the price remains well above $ 1,600. The next resistance located at $ 1,800 is the next bullish target to be reached. A bullish break in this resistance would boost the bullish momentum. The bullish movement could then continue towards the next resistance located at $ 1,860. After this resistance, buyers could then target $ 1,900.
The support levels are seen at $ 1,620 and $ 1,689 on the hourly chart. Ethereum price is bullish but climbing higher will be strict, our next target $ 1,783.
Also, it should be noted that some news said : the trust fund has added around 27,000 ETH right after opening worth around $ 38 million.
From this point, we guess there are some positive metrics in favor of ETH as well. Ethereum continues moving in a bullish trend from the support levels of $ 1,620 and $ 1,689.
Currently, the price is in a bullish channel. This is confirmed by the RSI indicator signaling that we are still in a bullish trending market.
As the price is still above the moving average (100), immediate support is seen at $ 1,620, which coincides with a golden ratio (61.8% of Fibonacci). Consequently, the first support is set at the level of $ 1,620. Hence, the market is likely to show signs of a bullish trend around the spot of $ 1,620 or/and $ 1,689.
Trading recommendations:
Signal : Buy orders are recommended above the golden ratio ($ 1,620) with the first target at the level of $ 1,783. Furthermore, if the trend is able to breakout through the first resistance level of $ 1,783. We should see the pair climbing towards the double top ( $ 1,783) to test it. The pair will move upwards continuing the development of the bullish trend to the level $1,800. It might be noted that the level of $1,860 is a good place to take profit because it will form a new double top in coming hours.
Trading analysis offered by RobotFX and Flex EA.
Source


Please do not spam; comments and reviews are verified prior to publishing.