We have stripped the WWW from WWW.ROBOTFX.ORG

Important Update for RobotFX Visitors

We want to sincerely apologize for any confusion or inconvenience caused by our recent website restructuring.

The main RobotFX hub has officially moved to our new, streamlined address at robotfx.org (without the "www" prefix). While our main operations have shifted, we want to reassure you that this archives site, old.robotfx.org, will remain fully active. You can still access our complete library of past posts, historical trading analysis, and legacy articles right here.

However, for the latest updates, newer content, and a significantly faster, more optimized browsing experience, we highly recommend heading over to our primary home at https://robotfx.org.

Thank you so much for your continued support and patience as we improve our digital services.

🎉 Weekly Special! 🎉

Use Coupon at Checkout:

LOADING...

Technical analysis on USDJPY for August 12th, 2022.

analytics62f66cfc15376.jpg

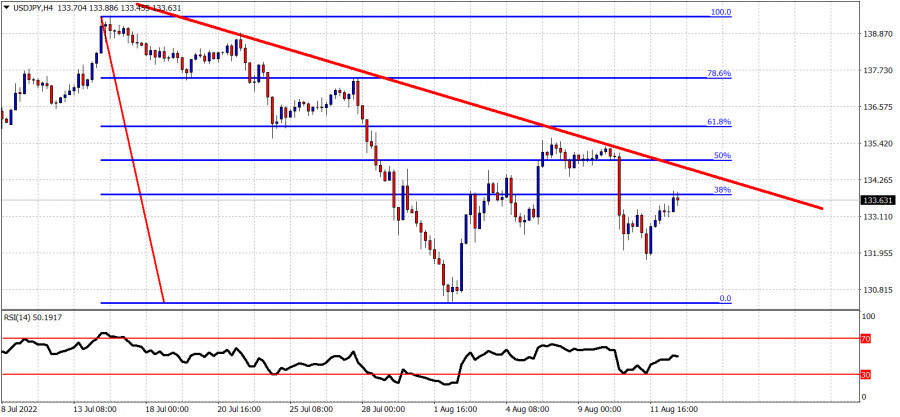
Red line -resistance trend line

Blue lines- Fibonacci retracements

USDJPY is bouncing after making a low at 131.75. The resistance trend line at 134.75 is the most important level for the short-term trend. With price having retraced more than 50% of the decline and rejected at the trend line resistance, it is important to see how strong bulls are. Bulls need to see price break above the red downward sloping trend line. This would provide a sign of strength and will increase chances of price moving towards the 61.8% Fibonacci retracement. Support remains key at recent low of 131.75. Bulls need to defend this level, otherwise if broken, we will see a fast decline towards 130.80 and lower.


Trading analysis offered by RobotFX and Flex EA.
Source
What 0 traders think of Technical analysis on USDJPY for August 12th, 2022.