We have stripped the WWW from WWW.ROBOTFX.ORG

Important Update for RobotFX Visitors

We want to sincerely apologize for any confusion or inconvenience caused by our recent website restructuring.

The main RobotFX hub has officially moved to our new, streamlined address at robotfx.org (without the "www" prefix). While our main operations have shifted, we want to reassure you that this archives site, old.robotfx.org, will remain fully active. You can still access our complete library of past posts, historical trading analysis, and legacy articles right here.

However, for the latest updates, newer content, and a significantly faster, more optimized browsing experience, we highly recommend heading over to our primary home at https://robotfx.org.

Thank you so much for your continued support and patience as we improve our digital services.

🎉 Weekly Special! 🎉

Use Coupon at Checkout:

LOADING...

Technical analysis on Ethereum for October 7th, 2022.

analytics63402306880df.jpg

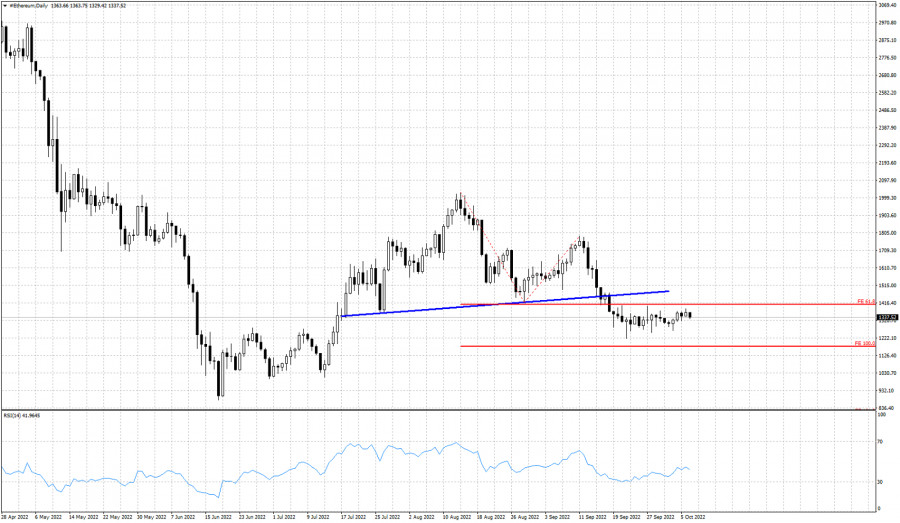
Blue line- neckline resistance

Red lines- Fibonacci extension targets

Ethereum is trading around $1,330. Price has mostly been moving sideways the last few weeks and bulls are unable to push price higher than $1,420. Price remains below the broken neckline of the Head and Shoulders pattern.The neckline at $1,470 is key resistance. Our $1,175 target remains intact, but taking into consideration the current price formation, a break below recent lows of $1,245, will lead to a deeper decline towards June lows at $900-$880.


Trading analysis offered by Flex EA.
Source
What 0 traders think of Technical analysis on Ethereum for October 7th, 2022.