We have stripped the WWW from WWW.ROBOTFX.ORG

Important Update for RobotFX Visitors

We want to sincerely apologize for any confusion or inconvenience caused by our recent website restructuring.

The main RobotFX hub has officially moved to our new, streamlined address at robotfx.org (without the "www" prefix). While our main operations have shifted, we want to reassure you that this archives site, old.robotfx.org, will remain fully active. You can still access our complete library of past posts, historical trading analysis, and legacy articles right here.

However, for the latest updates, newer content, and a significantly faster, more optimized browsing experience, we highly recommend heading over to our primary home at https://robotfx.org.

Thank you so much for your continued support and patience as we improve our digital services.

🎉 Weekly Special! 🎉

Use Coupon at Checkout:

LOADING...

Ichimoku cloud indicator analysis on EURUSD for January 16th, 2023.

analytics63c54e7f00a15.jpg

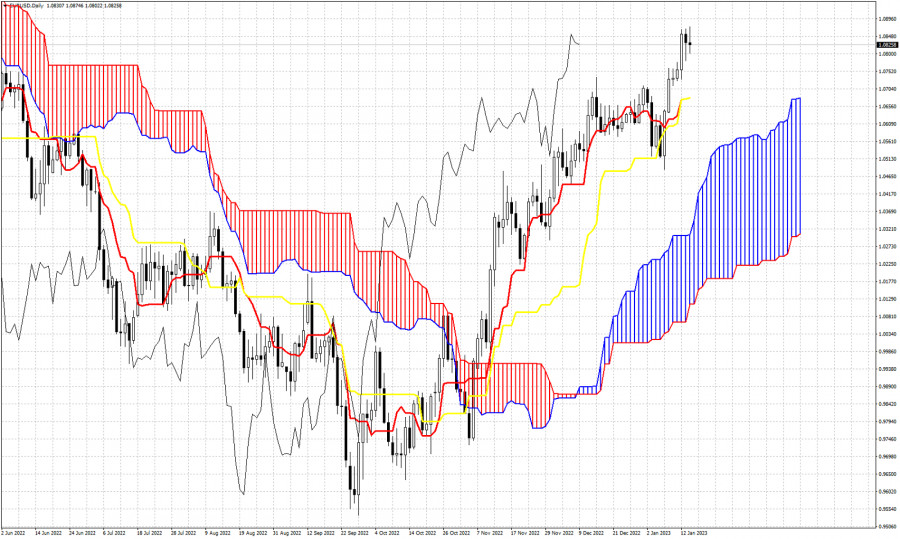
EURUSD is trading just above 1.08 as price is again under pressure following Friday's negative session. Technically trend remains bullish as price continues making higher highs and higher lows. In Ichimoku cloud terms, trend has not changed as price remains above the 4 hour Kumo (cloud). In the near term there are some overbought signs by oscillators and a pull back at least towards the tenkan-sen (red line indicator) at 1.0675 is justified. At 1.0675 we also find the kijun-sen (yellow line indicator). So this level around 1.0675 is very important support. Next support is found at the cloud at 1.0420. So far no sign of weakness.


Trading analysis offered by Flex EA.
Source
What 0 traders think of Ichimoku cloud indicator analysis on EURUSD for January 16th, 2023.