We have stripped the WWW from WWW.ROBOTFX.ORG

Important Update for RobotFX Visitors

We want to sincerely apologize for any confusion or inconvenience caused by our recent website restructuring.

The main RobotFX hub has officially moved to our new, streamlined address at robotfx.org (without the "www" prefix). While our main operations have shifted, we want to reassure you that this archives site, old.robotfx.org, will remain fully active. You can still access our complete library of past posts, historical trading analysis, and legacy articles right here.

However, for the latest updates, newer content, and a significantly faster, more optimized browsing experience, we highly recommend heading over to our primary home at https://robotfx.org.

Thank you so much for your continued support and patience as we improve our digital services.

🎉 Weekly Special! 🎉

Use Coupon at Checkout:

LOADING...

Ichimoku cloud indicator analysis on EURUSD for January 20th, 2023.

analytics63cabca853d01.jpg

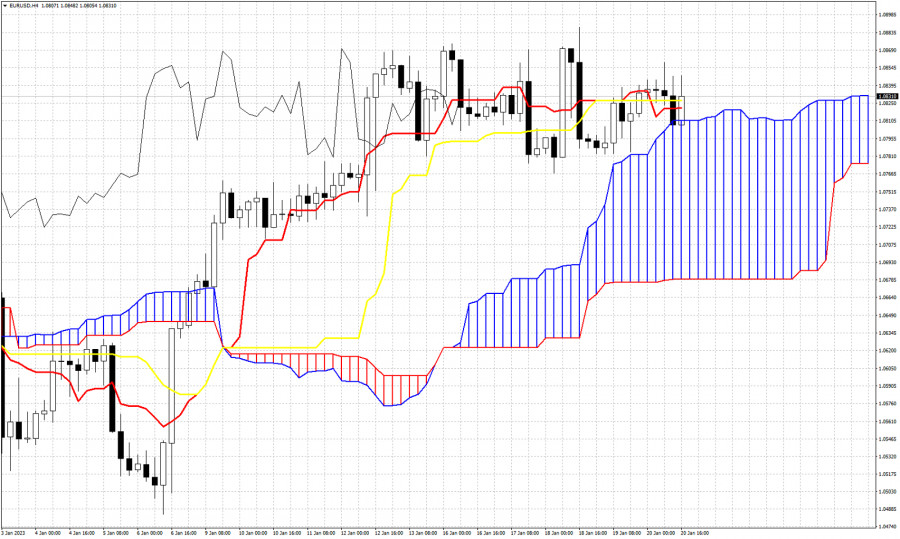
EURUSD is trading around 1.0838. Price tested the 4 hour Kumo (cloud) and support was held. Price is bouncing off the cloud support and is breaking above the tenkan-sen (red line indicator) and the kijun-sen (yellow line indicator). Recent price action confirms the importance of the cloud support at 1.0810. A break below this level will turn short-term trend to neutral. The area between 1.08 and 1.0680 is very important support for the medium-term. The Chikou span (black line indicator) does not provide a clear picture as it trades around the candlestick pattern with no clear position above or below. The tenkan-sen and kijun-sen are moving sideways with no clear slope. Next week will be decisive for EURUSD as we will see if price will continue higher towards 1.0950 or decline for a pull back towards 1.06.


Trading analysis offered by Flex EA.
Source
What 0 traders think of Ichimoku cloud indicator analysis on EURUSD for January 20th, 2023.