We have stripped the WWW from WWW.ROBOTFX.ORG

Important Update for RobotFX Visitors

We want to sincerely apologize for any confusion or inconvenience caused by our recent website restructuring.

The main RobotFX hub has officially moved to our new, streamlined address at robotfx.org (without the "www" prefix). While our main operations have shifted, we want to reassure you that this archives site, old.robotfx.org, will remain fully active. You can still access our complete library of past posts, historical trading analysis, and legacy articles right here.

However, for the latest updates, newer content, and a significantly faster, more optimized browsing experience, we highly recommend heading over to our primary home at https://robotfx.org.

Thank you so much for your continued support and patience as we improve our digital services.

🎉 Weekly Special! 🎉

Use Coupon at Checkout:

LOADING...

Ichimoku cloud indicator analysis on Gold for January 24th, 2023.

analytics63d000d2a1c03.jpg

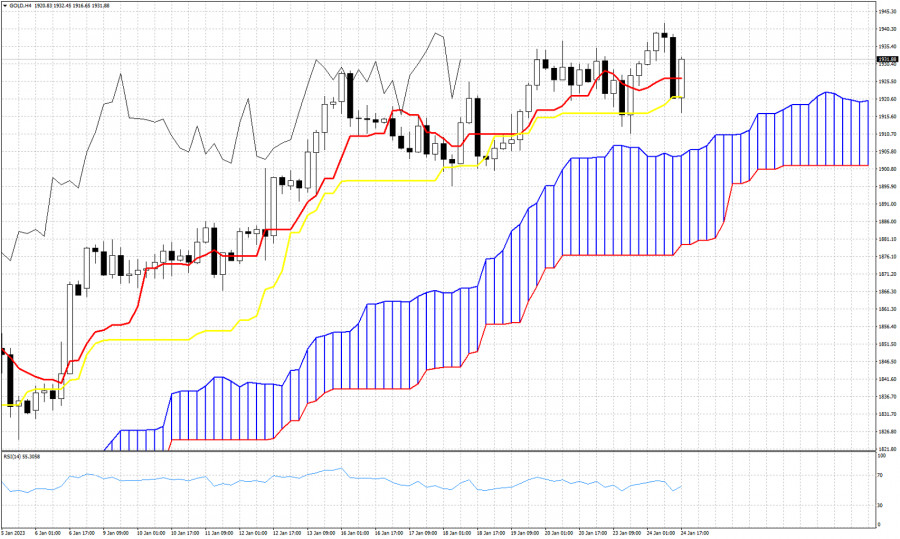
Gold price remains in a short-term bullish trend as price continues trading above the 4 hour Kumo (cloud). Support by the cloud is at $1,906. As long as price is above the Kumo, bulls will remain in control of the short-term trend. The tenkan-sen (red line indicator) and the kijun-sen (yellow line indicator) were recently tested by price. Both remain below current price. Both provide support at $1,921-26. A break below this short-term support level would be the first sign of weakness. So far price continues to respect both indicators. The Chikou span (black line indicator) confirms the bullish trend as it remains above the candlestick pattern. So far no sign of weakness in the 4 hour chart of Gold.


Trading analysis offered by Flex EA.
Source
What 0 traders think of Ichimoku cloud indicator analysis on Gold for January 24th, 2023.