We have stripped the WWW from WWW.ROBOTFX.ORG

Important Update for RobotFX Visitors

We want to sincerely apologize for any confusion or inconvenience caused by our recent website restructuring.

The main RobotFX hub has officially moved to our new, streamlined address at robotfx.org (without the "www" prefix). While our main operations have shifted, we want to reassure you that this archives site, old.robotfx.org, will remain fully active. You can still access our complete library of past posts, historical trading analysis, and legacy articles right here.

However, for the latest updates, newer content, and a significantly faster, more optimized browsing experience, we highly recommend heading over to our primary home at https://robotfx.org.

Thank you so much for your continued support and patience as we improve our digital services.

🎉 Weekly Special! 🎉

Use Coupon at Checkout:

LOADING...

Short-term technical analysis on Gold for January 19th, 2023.

analytics63c9602b227f8.jpg

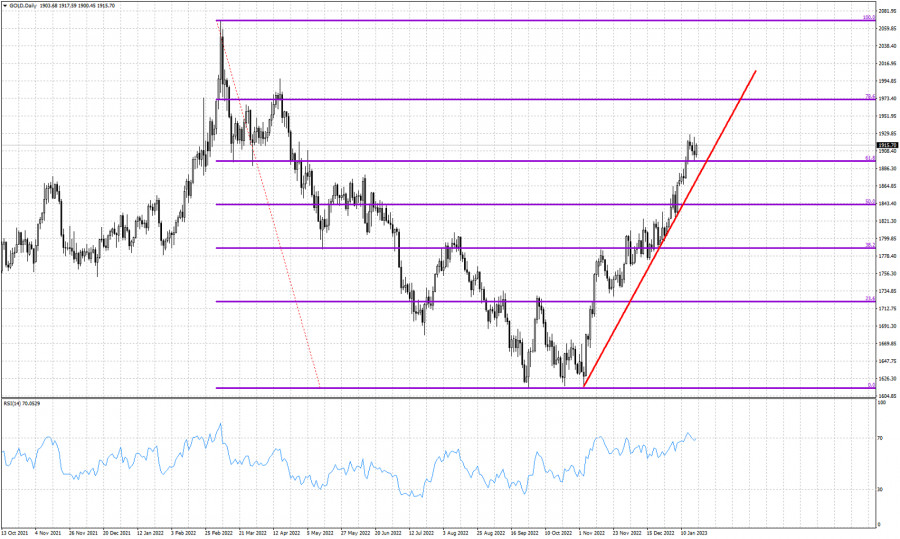
Red line- support trend line

Violet lines- Fibonacci retracement levels

Gold price is in a short-term bullish trend making higher highs and higher lows. Price continues to respect the red upward sloping trend line. Gold price has broken key Fibonacci resistance level of 61.8% at $1,896. At the 61.8% Fibonacci retracement we usually see trend reversals. Gold price has broken and back tested this level. The 61.8% level is now support. The RSI has reached overbought levels as Gold price climbs higher. So far there is no sign of a trend reversal. First sign of a reversal will be when price breaks below yesterday's lows and confirmation of the reversal will come with a break below the red support trend line. Until then bulls are in control.


Trading analysis offered by Flex EA.
Source
What 0 traders think of Short-term technical analysis on Gold for January 19th, 2023.