We have stripped the WWW from WWW.ROBOTFX.ORG

Important Update for RobotFX Visitors

We want to sincerely apologize for any confusion or inconvenience caused by our recent website restructuring.

The main RobotFX hub has officially moved to our new, streamlined address at robotfx.org (without the "www" prefix). While our main operations have shifted, we want to reassure you that this archives site, old.robotfx.org, will remain fully active. You can still access our complete library of past posts, historical trading analysis, and legacy articles right here.

However, for the latest updates, newer content, and a significantly faster, more optimized browsing experience, we highly recommend heading over to our primary home at https://robotfx.org.

Thank you so much for your continued support and patience as we improve our digital services.

🎉 Weekly Special! 🎉

Use Coupon at Checkout:

LOADING...

Technical analysis on the Dollar index for January 20th, 2023.

analytics63cabbfaa9c32.jpg

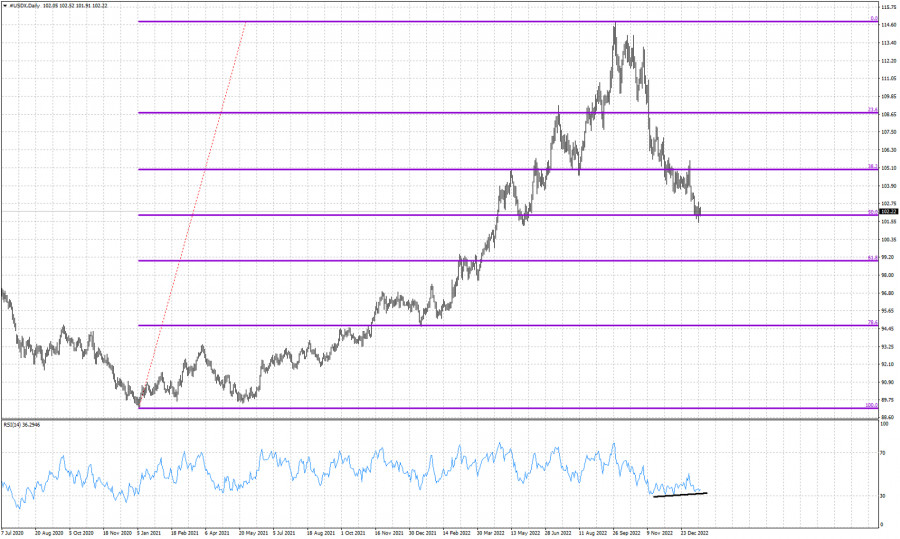
Violet lines- Fibonacci retracements

Black line- bullish RSI divergence

The Dollar index is trading around 102. Price has stopped the decline at the 50% Fibonacci retracement of the entire rise from the 89-90 base to the 114.70 highs. Technically short-term trend remains bearish. The RSI is providing bullish divergence signals in the Daily chart but this is not enough. Price must start a sequence of higher highs and higher lows in order for bulls to hope for a bigger reversal. So far price continues making lower lows and lower highs. Next major support is found at the 61.8% Fibonacci level. However before moving towards that level, at least a short-term bounce is expected.


Trading analysis offered by Flex EA.
Source
What 0 traders think of Technical analysis on the Dollar index for January 20th, 2023.