We have stripped the WWW from WWW.ROBOTFX.ORG

Important Update for RobotFX Visitors

We want to sincerely apologize for any confusion or inconvenience caused by our recent website restructuring.

The main RobotFX hub has officially moved to our new, streamlined address at robotfx.org (without the "www" prefix). While our main operations have shifted, we want to reassure you that this archives site, old.robotfx.org, will remain fully active. You can still access our complete library of past posts, historical trading analysis, and legacy articles right here.

However, for the latest updates, newer content, and a significantly faster, more optimized browsing experience, we highly recommend heading over to our primary home at https://robotfx.org.

Thank you so much for your continued support and patience as we improve our digital services.

🎉 Weekly Special! 🎉

Use Coupon at Checkout:

LOADING...

Ichimoku cloud indicator analysis on Gold for February 23rd, 2023.

analytics63f7909dbc4af.jpg

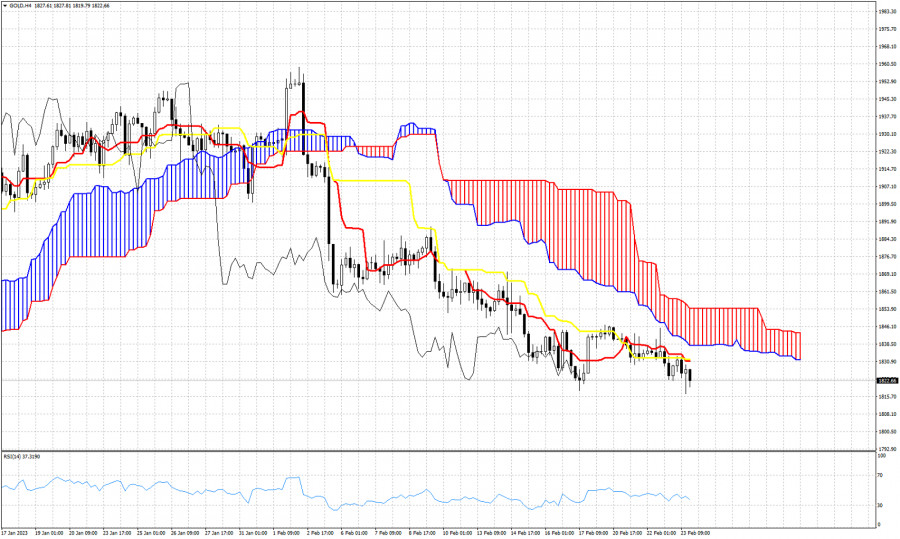
Gold price is making new lower lows today towards $1,817. Short-term trend remains bearish as price is still below the 4 hour Kumo (cloud). Both the tenkan-sen (red line indicator) and the kijun-sen (yellow line indicator) are above current price providing short-term resistance at $1,831. The Chikou span (black line indicator) is also below the candlestick pattern confirming bearish trend. In order to see a trend change, bulls must push price above $1,854 and the upper cloud boundary. In the mean time we find resistance at $1,831-32. Gold price remains in a sequence of lower lows and lower highs.


Trading analysis offered by Flex EA.
Source
What 0 traders think of Ichimoku cloud indicator analysis on Gold for February 23rd, 2023.