We have stripped the WWW from WWW.ROBOTFX.ORG

Important Update for RobotFX Visitors

We want to sincerely apologize for any confusion or inconvenience caused by our recent website restructuring.

The main RobotFX hub has officially moved to our new, streamlined address at robotfx.org (without the "www" prefix). While our main operations have shifted, we want to reassure you that this archives site, old.robotfx.org, will remain fully active. You can still access our complete library of past posts, historical trading analysis, and legacy articles right here.

However, for the latest updates, newer content, and a significantly faster, more optimized browsing experience, we highly recommend heading over to our primary home at https://robotfx.org.

Thank you so much for your continued support and patience as we improve our digital services.

🎉 Weekly Special! 🎉

Use Coupon at Checkout:

LOADING...

Bitcoin analysis for March 27th, 2023.

analytics6421aa28e3b31.jpg

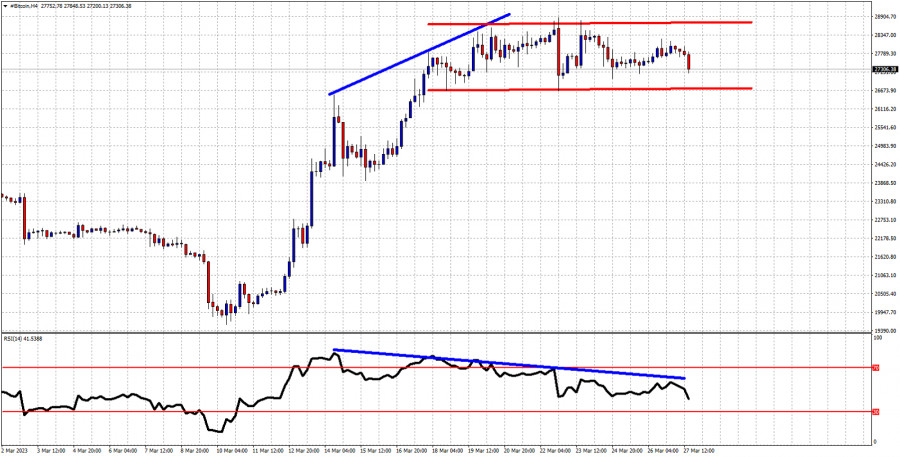
Blue lines- bearish RSI divergence

Red lines- trading range

Bitcoin is trading around $27,300. Over the last couple of sessions price has made no real progress to the upside or the downside. Price is trading mostly sideways inside a trading range. The RSI has provided us with a bearish divergence signal. Short-term support is found at the lower range boundary at $26,700. A break below the lower red range boundary will bring even more sellers and will most probably push price towards $24,500. Resistance is found at $28,880. Recapturing this level would be an important bullish sign.


Trading analysis offered by Flex EA.
Source
What 0 traders think of Bitcoin analysis for March 27th, 2023.