We have stripped the WWW from WWW.ROBOTFX.ORG

Important Update for RobotFX Visitors

We want to sincerely apologize for any confusion or inconvenience caused by our recent website restructuring.

The main RobotFX hub has officially moved to our new, streamlined address at robotfx.org (without the "www" prefix). While our main operations have shifted, we want to reassure you that this archives site, old.robotfx.org, will remain fully active. You can still access our complete library of past posts, historical trading analysis, and legacy articles right here.

However, for the latest updates, newer content, and a significantly faster, more optimized browsing experience, we highly recommend heading over to our primary home at https://robotfx.org.

Thank you so much for your continued support and patience as we improve our digital services.

🎉 Weekly Special! 🎉

Use Coupon at Checkout:

LOADING...

IBM stock price surpassing our second target

analytics6411f5a083e9d.jpg

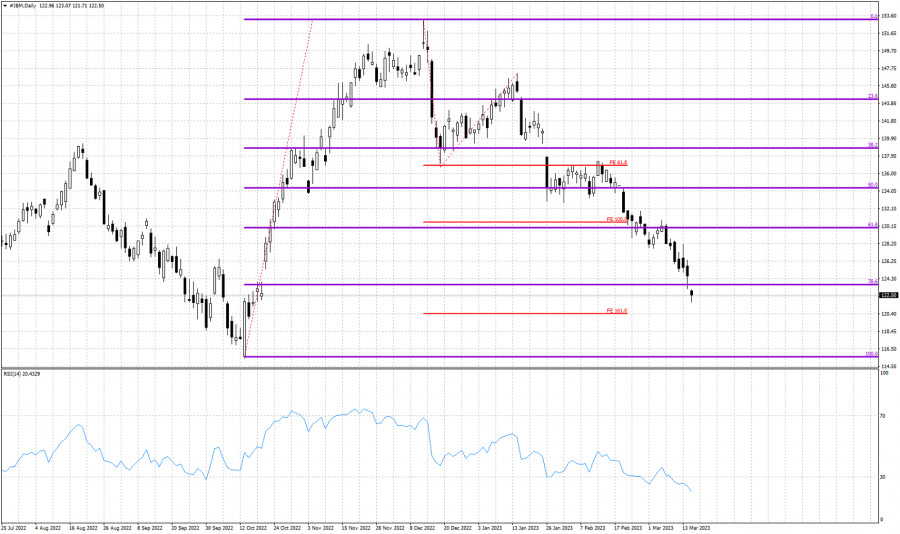
Violet lines- Fibonacci retracements

Red lines- Fibonacci extension levels

We have been bearish IBM stock for some time now. Price remains in a bearish short-term trend making lower lows and lower highs. Price has surpassed the 61.8% Fibonacci support level and the 100% extension target. This was our second target area. Price is now approaching the 3rd target area of the 161.8% Fibonacci extension. Price today is trading below the 78.6% Fibonacci support level. Such price action is bearish and there are increased chances that over the coming weeks price will eventually break below October 2022 lows. The RSI is at oversold levels. A short-term bounce is justified, but we believe only as a pause to the downtrend.


Trading analysis offered by Flex EA.
Source
What 0 traders think of IBM stock price surpassing our second target