We have stripped the WWW from WWW.ROBOTFX.ORG

Important Update for RobotFX Visitors

We want to sincerely apologize for any confusion or inconvenience caused by our recent website restructuring.

The main RobotFX hub has officially moved to our new, streamlined address at robotfx.org (without the "www" prefix). While our main operations have shifted, we want to reassure you that this archives site, old.robotfx.org, will remain fully active. You can still access our complete library of past posts, historical trading analysis, and legacy articles right here.

However, for the latest updates, newer content, and a significantly faster, more optimized browsing experience, we highly recommend heading over to our primary home at https://robotfx.org.

Thank you so much for your continued support and patience as we improve our digital services.

🎉 Weekly Special! 🎉

Use Coupon at Checkout:

LOADING...

Ichimoku cloud indicator analysis on EURUSD for March 17th, 2023.

analytics64148de4166fa.jpg

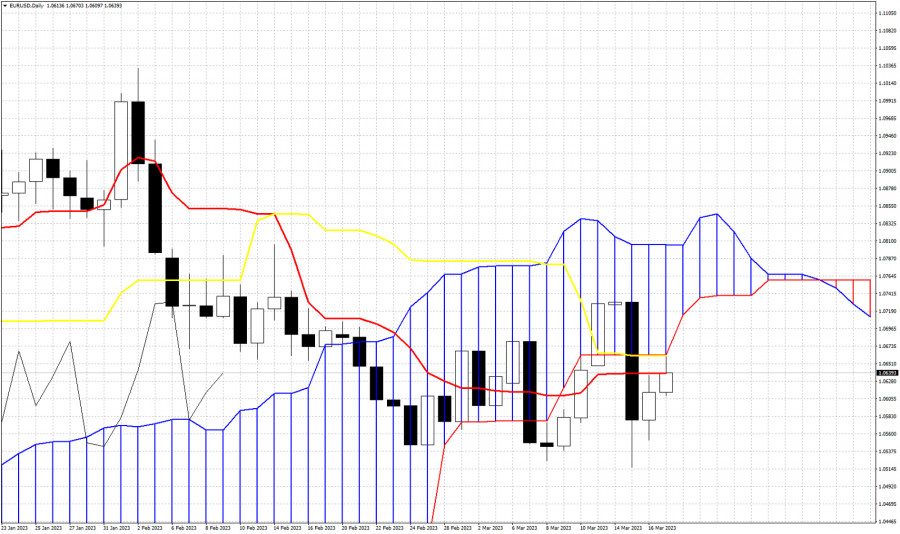
EURUSD is trading around 1.0645 as price is bouncing off the recent lows at 1.0517. Price remains in bearish trend according to the Ichimoku cloud indicator in the Daily chart as price is still below the Kumo (cloud). EURUSD is testing the lower cloud boundary and the tenkan-sen (red line indicator) and the kijun-sen (yellow line indicator). These two indicators provide resistance at 1.0638 and 1.0661 respectively. The lower cloud boundary is also found at 1.0661. Bulls need to recapture at least 1.0661 in order to hope for a bigger move higher. The Chikou span (black line indicator) is still below the candlestick pattern, but has bounced off cloud support. Support is at 1.0575 and bulls need to defend this level in order to hope for a move higher. Failure to hold above 1.0575 will bring more selling pressures.


Trading analysis offered by Flex EA.
Source
What 0 traders think of Ichimoku cloud indicator analysis on EURUSD for March 17th, 2023.