We have stripped the WWW from WWW.ROBOTFX.ORG

Important Update for RobotFX Visitors

We want to sincerely apologize for any confusion or inconvenience caused by our recent website restructuring.

The main RobotFX hub has officially moved to our new, streamlined address at robotfx.org (without the "www" prefix). While our main operations have shifted, we want to reassure you that this archives site, old.robotfx.org, will remain fully active. You can still access our complete library of past posts, historical trading analysis, and legacy articles right here.

However, for the latest updates, newer content, and a significantly faster, more optimized browsing experience, we highly recommend heading over to our primary home at https://robotfx.org.

Thank you so much for your continued support and patience as we improve our digital services.

🎉 Weekly Special! 🎉

Use Coupon at Checkout:

LOADING...

Ichimoku cloud indicator analysis on Gold for March 21st, 2023.

analytics6419c7f7dc088.jpg

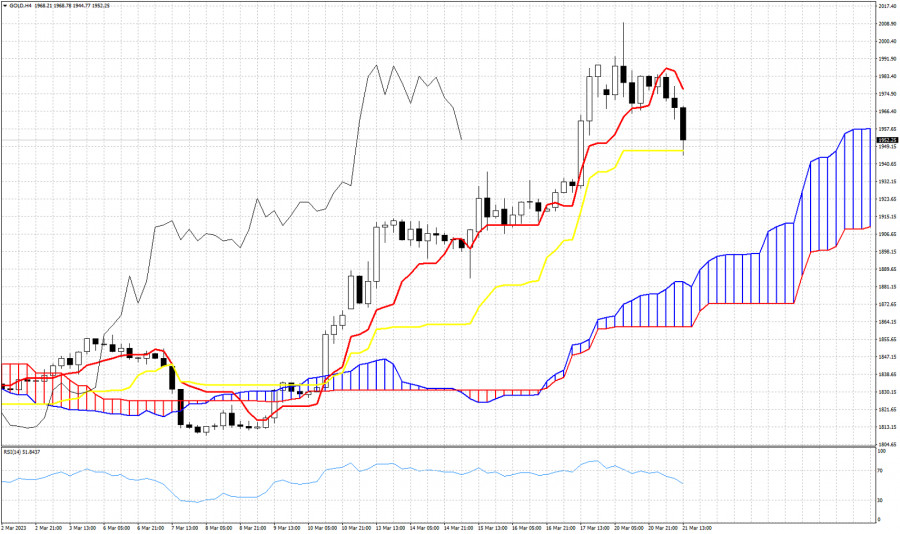
Gold price is trading around $1,950. Trend remains bullish but there are signs of vulnerability. Gold price has broken below the tenkan-sen (red line indicator) and is challenging the kijun-sen (yellow line indicator). The kijun-sen provides support at $1,947. A break below the kijun-sen will put pressure on Gold price and will most probably push it towards the cloud support (Kumo) at $1,900. Resistance by the tenkan-sen is found at $1,977. A break above this level will increase chances of a new upward wave above $2,000.


Trading analysis offered by Flex EA.
Source
What 0 traders think of Ichimoku cloud indicator analysis on Gold for March 21st, 2023.