Fresh from RobotFX: in-depth analysis to support your trading decisions.

The USD/CAD pair is trading below the round level of 1.3900, remaining in a consolidation phase. Technical analysis of the daily chart shows that the RSI—the 14-day Relative Strength Index—is at the 60 level, indicating a bullish trend and the absence of overbought conditions. The RSI remaining above its 50-line prevents deep corrections.
The nine-day exponential moving average (EMA) has turned upward and converged with the 50-day EMA, while the price is holding above both moving averages, maintaining an upward bias. After a prolonged decline, the 50-day EMA is now flattening, signaling a weakening of downward pressure.
Capture price channel breakouts with the Price Channel Expert Advisor. Precise entries and exits. Explore now.
As long as the USD/CAD pair holds above the short-term averages, the bias remains for a breakout above the round 1.3900 level, a break of resistance at 1.3920, and a test of 1.3950, with the possibility of testing 1.3970.
A correction would find initial support at the confluence of the rising nine-day EMA and the 50-day EMA at 1.3864. A drop below the moving averages would slow the advance and shift risk in favor of the bears. As long as the oscillators on the daily chart remain positive, bulls have little to fear.
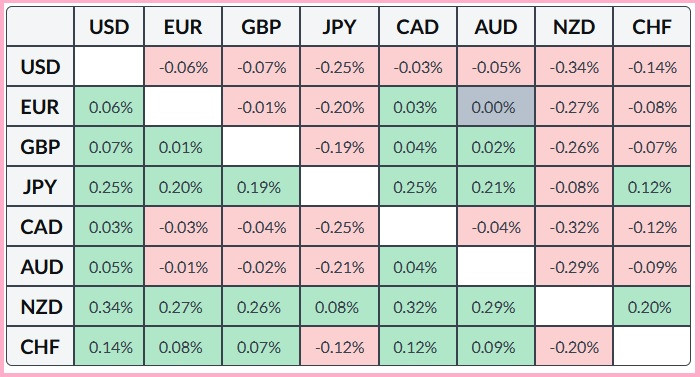
The table below shows the percentage change of the Canadian dollar against the major currencies today. The Canadian dollar showed the greatest strength against the U.S. dollar.
Enhance your trading strategy with advanced tools from RobotFX. Explore our expert advisors and indicators at www.robotfx.org.


Please do not spam; comments and reviews are verified prior to publishing.